Abstract
This study aims to provide unequivocal physical interpretations of electrochemical impedance spectroscopy (EIS) results for electric double layer capacitor (EDLC) electrodes and devices. To do so, a physicochemical transport model was used for numerically reproducing Nyquist plots accounting for (i) electric double layer (EDL) formation at the electrode/electrolyte interface, (ii) charge transport in the electrode, and (iii) ion electrodiffusion in binary and symmetric electrolytes. Typical Nyquist plots of planar EDLC electrodes were reproduced and interpreted numerically for different electrode conductivity and thickness, electrolyte domain thickness, as well as ion diameter, diffusion coefficient, and concentrations.
Analysis
Electrochemical impedance spectroscopy (EIS) consists of imposing a time-harmonic oscillating electric potential ψs(t) of small oscillation amplitude (e.g., less than 10 mV) around a time-independent “DC potential” at the electrode surfaces and measuring the resulting harmonic current density js(t) [1–3]. Using complex notations, the imposed electric potential ψs(t) and the resulting current density js(t) can be expressed as [1,4–6]
where ψdc is the time-independent DC potential, ψ0 is the amplitude of the oscillating potential at frequency f, jdc is the time-independent DC current density, j0 is the amplitude of the oscillating current density, and ϕ(f) is the frequency-dependent phase angle between the imposed potential ψs(t) and the current density js(t). Then, the electrochemical impedance Z can be defined as [1,4–6]
where Zre and Zim (expressed in Ω m²) are the real and imaginary parts of the complex impedance, respectively. A typical Nyquist plot presents the imaginary part −Zim as a function of the real part Zre of the complex impedance of an EDLC electrode or an EDLC device.
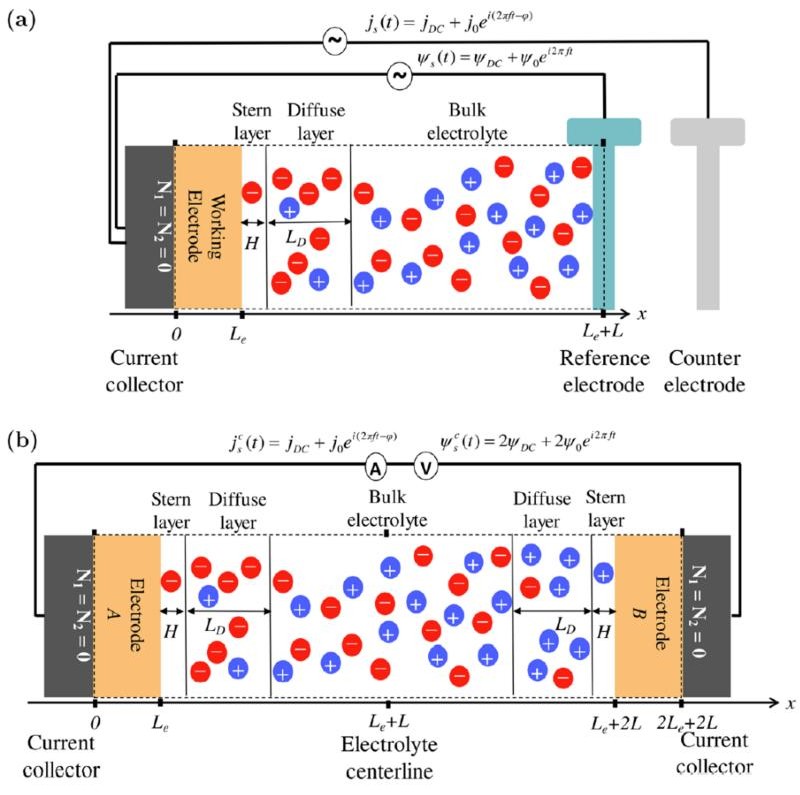
Figure 1 shows (a) the simulated one-dimensional domain consisting of a planar current collector supporting a working electrode of thickness Le and an electrolyte domain of thickness L corresponding to a three-electrode setup and (b) an EDLC device consisting of two identical electrodes of thickness Le separated by an electrolyte domain of thickness 2L. The electrolyte near each electrode consisted of a Stern layer of thickness H and a diffuse layer of mobile ions of thickness LD. Simulations reported in this study were based on the modified Poisson–Nernst–Planck (MPNP) model for binary and symmetric electrolytes for EDLC electrodes or devices [7–9]. The governing equations, initial and boundary conditions, and method of solution were described in detail in Refs. [9,10]. The electrical conductivity and thickness of the electrode, the effective ion diameter, ion diffusion coefficient, bulk ion concentration in the electrolyte, and the length of the electrolyte domain were treated as variables to assess the effects of electrode and electrolyte resistances and electrode capacitance on the Nyquist plots of a single EDLC electrode.
Results
Figure 2 summarizes the physical interpretation of the Nyquist plots computed numerically for a wide range of cases with different electrode conductivity and thickness, electrolyte thickness, and ion diameters, concentrations, and diffusion coefficients.
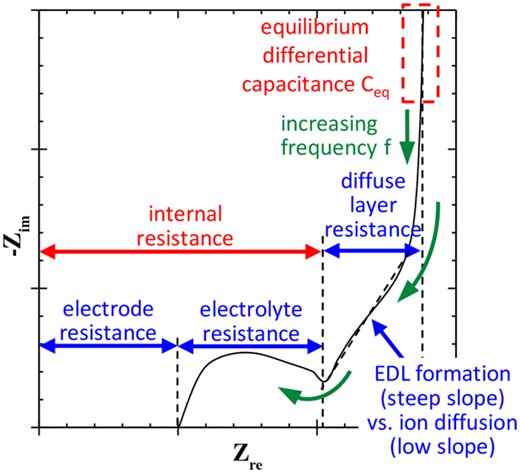
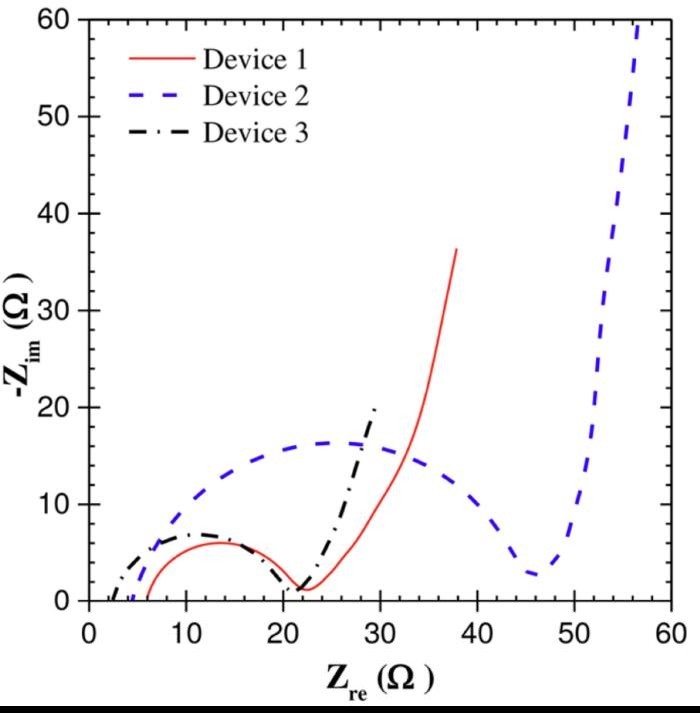
Figure 3 shows the Nyquist plots obtained experimentally for EDLC devices consisting of activated carbon electrodes and electrolytes of (1) 1 M LiPF6 in EC:DMC (1:1), (2) 1 M citric acid in DI water, and (3) 1 M TEABF4 in acetonitrile. It indicates that the electrode resistance Reexp was small and did not vary significantly among the three devices. This is consistent with the fact that the electrodes of all three devices were nearly identical and made of activated carbon [11]. In addition, the electrode resistance Reexp was small compared with the bulk electrolyte resistance R∞exp, which contributed the most to the internal resistance. Moreover, the bulk electrolyte resistance R∞exp for Device 2 was much larger than that for Devices 1 and 3. This can be attributed to the fact that citric acid is a weak electrolyte featuring low ionic conductivity. Furthermore, the internal resistance of the devices retrieved from the Nyquist plot was in good agreement with the resistance retrieved from the “IR drop” in galvanostatic cycling. These results were consistent with the physical interpretation derived from numerical simulations and illustrated in Figure 2.
Conclusions
- The electrode resistance, bulk electrolyte resistance, diffuse layer resistance, and equilibrium differential capacitance can be retrieved directly from Nyquist plots.
- The internal resistance retrieved from the sum of electrode and bulk electrolyte resistances in EIS simulations showed good agreement with the internal resistance retrieved from the so-called “IR drop” in galvanostatic cycling.
- The interpretations were confirmed experimentally for EDLC devices with electrodes made of activated carbon and various electrolytes.
See also the companion study on redox-active (pseudocapacitive and battery-like) electrodes: B.-A. Mei, J. Lau, T. Lin, S.H. Tolbert, B. Dunn, and L. Pilon, 2018. “Physical Interpretations of Electrochemical Impedance Spectroscopy of Redox Active Electrodes for Electrical Energy Storage,” The Journal of Physical Chemistry C, Vol. 122, No. 43, pp. 24499–24511. doi:10.1021/acs.jpcc.8b05241
References
- X.Z. Yuan, C. Song, H. Wang, and J. Zhang, Electrochemical Impedance Spectroscopy in PEM Fuel Cells: Fundamentals and Applications, Springer-Verlag, London, UK, 2010.
- D. Pech, M. Brunet, H. Durou, P. Huang, V. Mochalin, Y. Gogotsi, P.-L. Taberna, and P. Simon, “Ultrahigh-power micrometre-sized supercapacitors based on onion-like carbon,” Nature Nanotechnology, Vol. 5, No. 9, pp. 651–654, 2010.
- H. Itoi, H. Nishihara, T. Kogure, and T. Kyotani, “Three-dimensionally arrayed and mutually connected 1.2-nm nanopores for high-performance electric double layer capacitor,” Journal of the American Chemical Society, Vol. 133, No. 5, pp. 1165–1167, 2011.
- A.J. Bard and L.R. Faulkner, Electrochemical Methods: Fundamentals and Applications, 2nd ed., John Wiley & Sons, New York, NY, 2001.
- A. Lasia, “Electrochemical impedance spectroscopy and its applications,” in Modern Aspects of Electrochemistry, No. 32, B.E. Conway, J.O’M. Bockris, and R.E. White, Eds., Chapter 2, pp. 143–248, Kluwer Academic Publishers, New York, NY, 2002.
- M.E. Orazem and B. Tribollet, Electrochemical Impedance Spectroscopy, John Wiley & Sons, Hoboken, NJ, 2008.
- L.H. Olesen, M.Z. Bazant, and H. Bruus, “Strongly nonlinear dynamics of electrolytes in large ac voltages,” Physical Review E, Vol. 82, 011501, 2010.
- M.S. Kilic, M.Z. Bazant, and A. Ajdari, “Steric effects in the dynamics of electrolytes at large applied voltages. II. Modified Poisson–Nernst–Planck equations,” Physical Review E, Vol. 75, 021503, 2007.
- H. Wang and L. Pilon, “Intrinsic limitations of impedance measurements in determining electric double layer capacitances,” Electrochimica Acta, Vol. 63, pp. 55–63, 2012.
- H. Wang and L. Pilon, “Mesoscale modeling of electric double layer capacitors with three-dimensional ordered structures,” Journal of Power Sources, Vol. 221, pp. 252–260, 2013.
- O. Munteshari, J. Lau, A. Krishnan, B. Dunn, and L. Pilon, “Isothermal calorimeter for measurements of time-dependent heat generation rate in individual supercapacitor electrodes,” Journal of Power Sources, Vol. 374, pp. 257–268, 2018.